
In this week I have flew home, after spending few weeks in Seattle for the Blue Hat and some meeting with the team (and even for some fun in the night, I admit 😉 ). For whoever doesn’t know, starting from the September 2016 I am a Security Researcher of the Threat Intelligence Center of Microsoft Ltd (MSTIC).
BlueHat was great. Me and my friend Richard Johnson (@richinseattle) have presented a talk regarding our last research work about the Intel Processor Trace. I have idealized, tested and developed the first Windows PT driver, and he has researched the way to use the driver in his high-speed fuzzer project (FuzzFlow).
At the time of this writing, the driver is stable and works well (much more than I expected). You can find it in the Repository built by Rich:
https://github.com/talos-vulndev/TalosIntelPtDriver
We have received tons of comments and questions regarding our work. Here I would like to clarify some of these.
Question 1. Is the technology ready to trace Kernel Mode code?
The answer is Yes, even though at the time of the presentation I have not inserted this feature directly in the driver’s code, with some simple modifications you could be able to trace Kernel Mode code, Hypervisor and even SMM.
Last week I had passed something like 17 hours in 2 flights from Seattle to Milano (my native city) and, due to the fact that I didn’t know how to stay calm, I have decided to start the implementation of a new version of the driver with a complete support for kernel mode tracing.
The usage is quite simple:
- Import the “TalosIntelPtDriver.lib” and “KernelTracing.h” files in your kernel mode driver project (I have not any kind of wish to explain how)
- Allocate the needed buffer descriptor using IntelPtAllocBuffer function:
NTSTATUS IntelPtAllocBuffer(PPT_BUFFER_DESCRIPTOR * pBuffDesc, QWORD qwSize, BOOLEAN bUseTopa, BOOLEAN bSetStdPmi = TRUE);
- Allocate and fill a PT_TRACE_DESC structure with the needed parameters for tracing
- Start the tracing in the current execution processor using the IntelPtStartTracing routine:
NTSTATUS IntelPtStartTracing(PT_TRACE_DESC traceDesc, PT_BUFFER_DESCRIPTOR * pBuffDesc);
- Run the kernel code that you prefer (always in the same processor that has called the IntelPtStartTracing routine) and when finished, call IntelPtStopTrace function
- Free any allocated buffer using IntelPtFreeBuffer
Using these 6 steps, and a trick, I was able to do 2 cool things:
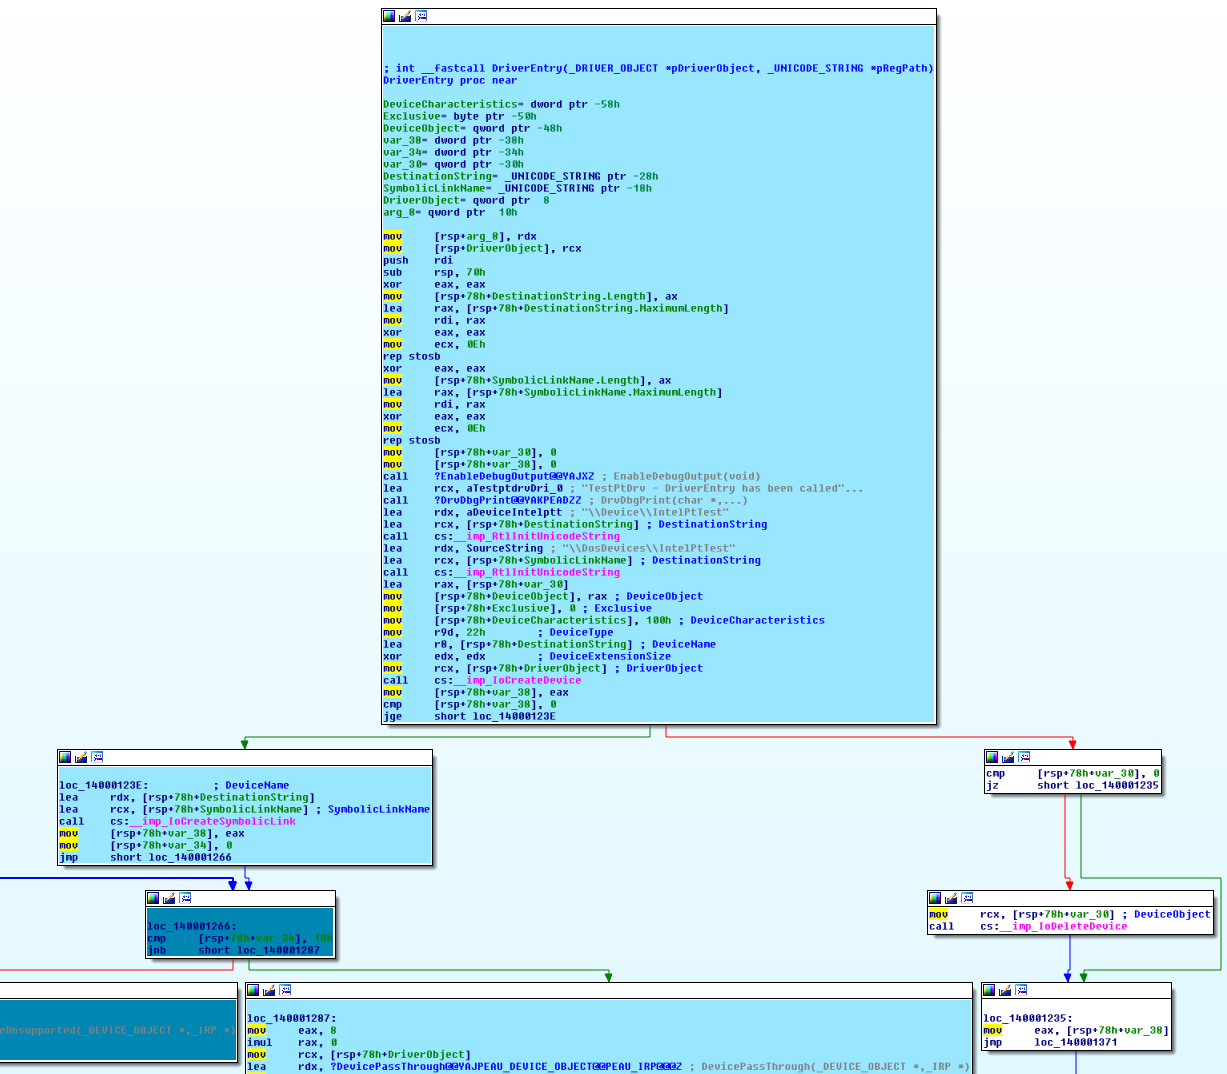
- Get a full trace of a test driver.
How? It was not easy. Using the proper Structure Exception Handlers, I was able to insert a special “bad-opcode” byte in the beginning of the target driver’s entry point. I caught the exception from the monitoring driver, started the Processor Trace, modified the bad opcode and resumed the execution. In this way, I succeeded in tracing a full-blown driver initialization and unload functions.
Of course, you have to design some simple kernel code to dump the PT binary buffer in a file, but this is a very-easy task 🙂
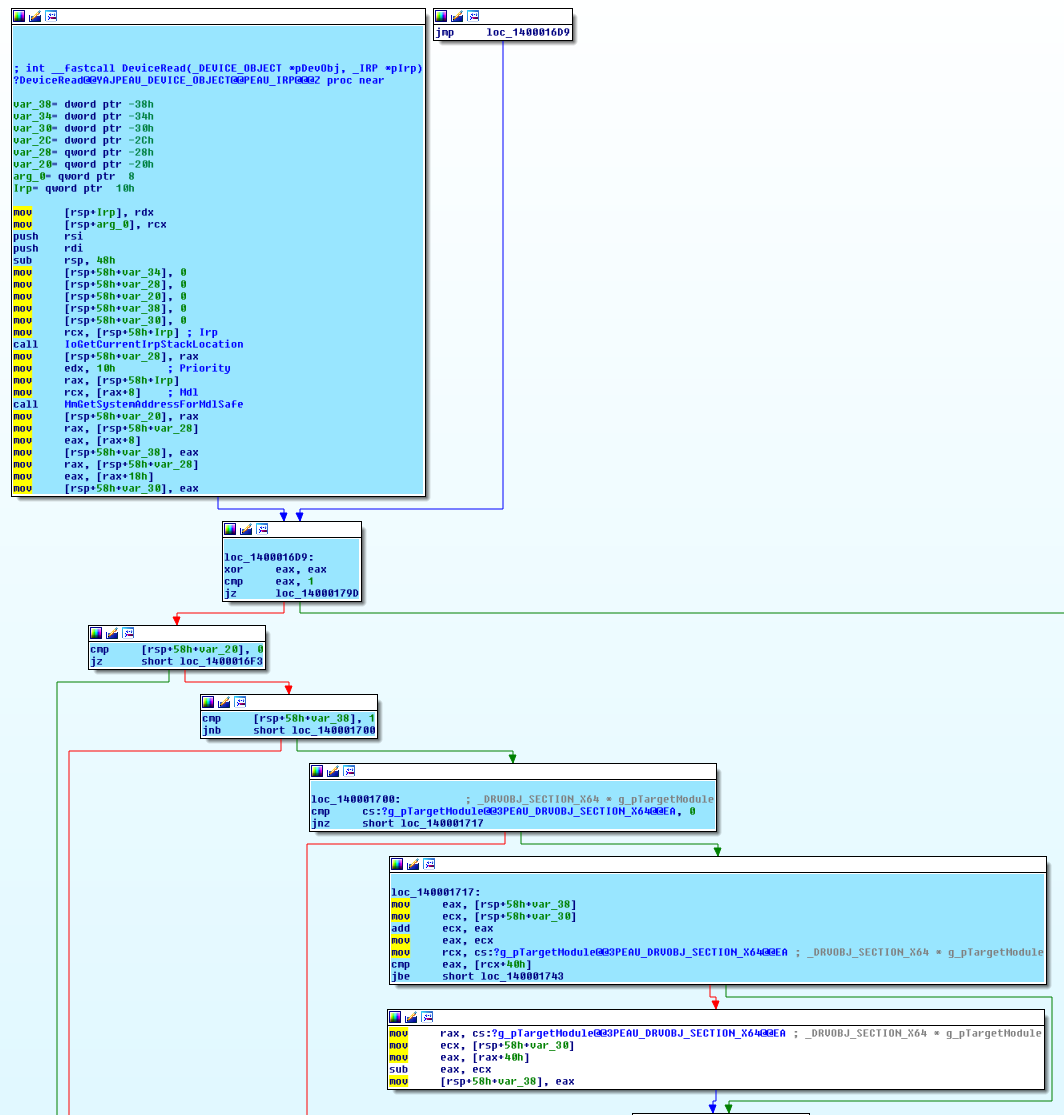
- Get a full trace of an “already-loaded” kernel module.
Easier than the previous case but much more time-consuming. Indeed, I passed the following few days in Cheltenham implementing the Kernel tracing support from User-mode. After succeeded in modifying the driver architecture (very long task), I simply created a big buffer, grabbed the target module start and end address, and started PT using the “tracing by IP” modality and the new Kernel Tracing feature.
Feeding the buffer to my IDA plugin yields interesting and cool results (My IDA plugin is doing his job greatly, even if I still continue to hate Python 🙂 ) :
As said, I have even inserted in the user-mode code, the possibility to trace kernel mode software, even if I think that it could be a security flaw. Someone has tried to convince me that, if the user is an Administrator, it could be allowed to trace kernel-mode code. What do you think? I will appreciate if the readers could tell me what do they think.
Question 2. Does Microsoft plan to implement Intel PT in Windows 10?
I really have no idea. I am still too new and usually I can’t reveal this kind of information without an explicit permission. The only thing that I know is that I will love to work with Skywing, Skape or some Kernel guys to implement this inside the Windows OS.
Question 3. Do you guys plan to release the Slides and the IDA plugin?
While the driver code is already online (still not the one with Kernel Mode support, I was working on the sanitization of this code), after speaking with my current manager (Cristian), he allowed me to release the IDA plugin and the Test user application.
You can find the IDA plugin here:
https://github.com/intelpt/IntelPt_Compiled/tree/master/plugin
You can find even the latest beta compiled version of the Kernel driver and test application here:
https://github.com/intelpt/IntelPt_Compiled/
(It still requires the Test Signing Mode enabled)
Keep an eye opened on this repository. More things will arrive soon 🙂
For the recording and the slides of the talk, it depends on the BlueHat organizers. I have no plan to publish it for the global public. If you are interested send me an email to info@andrea-allievi.com or ask to the conference organizers (bluehat@microsoft.com) for all the information.
Question 4: Why don’t I publish the signed driver used in the demo?
I have bought a personal digital signature but I still don’t want to risk to publish a vulnerable driver that could be used for disable the OS protections or similar. If Rich, Zer0mem, Nicolas or some great hacker will try to exploit the code, I will be sure that it won’t contain any vulnerability. At that time I will publish the signed one.
Question 5: Ok, all this stuff is great, but what about real usage in multi-processor environment?
This is not an easy task. We are currently working on implementing this. But I would like to invite the interested reader to the next Recon Conference (if Hugo will accept us of course). In that talk I will explain how we have overcame this problem, how I have used the new features to analyse some Malware, and Rich will introduce the new features of his FuzzFlow. We’ll wait some smart security researcher! 🙂
In conclusion, this is definitively a damn interesting technology, with a lot of useful real case usage. Mixed with a Hypervisor (my implementation is still private, check the Satoshi or Alex Ionescu Hypervisor for example), we can definitively create even an off-line post execution engine used for tracing step-by-step whatever software we would like.
I wait some tips by the readers for the future improvements other than the Multi-Processor support. In the next European Recon conference (if we will be accepted of course), we would like to show the multi-processor execution and some real cases of its usage (fuzzing for example) with Intel PT.
I am even working on a quick video movie that shows how to use this.
11/26/2016 Update:
As some of you have allow me to notice this (thanks @long123king and @hacksysteam), at the time of this writing, no Type-1 (bare-metal) hypervisors are compatible with the Intel PT driver. This is because the CPUID (leaf 7 and 20) instruction is trapped by the Hypervisor and the PT bits are stripped down. Furthermore, based on our test, even the VM-Exit caused by the acquiring/modification of the PT-related Model Specific Register (MSR) are caught and invalidated.
To proper work with the Windows Intel PT Driver, you need to disable vSphere ESXi, HyperV (and even Device Guard, that deeply rely on it) or any Type-1 hypervisor (not VmWare Workstation, that is a Type-2 Hypervisor).
For HyperV you can use the procedure described here:
Keep in mind that this will lower the overall security of your system if Device Guard will be disabled.
As usual, stay tuned!
Cheers,
Andrea