
A lot of people nowadays ask me how, as part of my job, I debug UEFI firmware images, initial boot code and boot transitions. This happened in particular actual after the release of the excellent analysis by ESET of a new powerful UEFI bootkits, BlackLotus, able to extract the Bitlocker master key and bypass Secure Boot.
Internally in my company, we have worked a lot for improving the debugger experience (especially in the HV and SK world, with a lot of new cool features). Last week, my colleague Alexis (who is the “debugger” guy 😊), told me that one of those amazing feature that we built was release publicly: WindbgExdi (which has the source code available here).
Before explaining what WindbgExdi is, let’s do an introduction on how, in the year 2023, companies approach (or at least they should approach) the debugging “problem” for Firmware and super-low-level code:
- Using a JTAG probe, which interfaces directly to the CPU. A JTAG Debugger is usually very expensive and is directly tied to the hardware that you are debugging. Examples of JTAG probe are here and here. Due to the complexity and cost of these solutions, this kind of debugging is not very diffused.
- Using EXDI (Extended Debugging Interface) over DCI (Direct Connect Interface). This is a technology designed by Intel (I have no idea if AMD has a similar one) to allow developers to debug the whole system without depending on a software provided debugging mechanism.
- Using a Software emulator or an Hypervisor with integrated hardware debugger.
You can think of DCI as a technology that forward trace and debug data coming from a specialized debugging interface integrated in the CPU (the Trace Hub) to a DCI transport. The DCI transport can be out-of-band, or OoB, independent of the USB protocol; or in-band, referred to as USB Debug Class. The in-band DCI uses the USB protocol to communicate with a debug endpoint in the USB controller. Both methods communicate with various different debug agents in the SoC to perform debug communication, run control, DMA, and trace. While OoB DCI requires still specialized hardware (but way more generalized and cheaper than JTAG), in-band DCI requires only a “special” USB cable. My friend Satoshi, 2 years ago, released an excellent guide on how to debug over DCI. I suggest interested readers to read it.
EXDI-over-DCI is very powerful, but does not work in production environments (unless hacked, as Satoshi stated in his guide. DCI is so powerful that having it enabled in production would have been a big security vulnerability indeed). So how an amateur or a Reverse Engineer can debug those sort of things without loosing hours with dummy “println-style” debug?
The answer arrived with the software emulators and certain Hypervisor solutions. Both QEMU and WMware for example supports a GDB debugger integrated directly into the virtual processor. I will not talk about VMware in this article, being a competitor to the Company that I am currently working on (otherwise Alex’s crew would probably kick my ass 😊😂😂), but I will talk about QEMU, which is open source and available to everyone (unfortunately I can *not* take a look in any way to its source code due to some legal stuff in its license that I do not want to deal with).
QEMU, when it works (it is pretty hard to configure and, furthermore, it has some bugs that the developers behind that do not seem to care), has a powerful GDB debugger stub which work quickly and very effective, integrated directly in the VM Virtual processors engine. You can debug everything with it, from the CPU reset vector up to the long-mode OS. QEMU is also multi-platform, allowing different architectures to be debugged on a different host (cross-platform, for example running a ARM64 VM on a AMD64 host). The problem with the GDB debugger was that Windbg implements another proprietary standard (DbgEng), meaning that Windbg was not able to work with GDB packets. And here is where WindbgExdi comes to rescue.
WindbgExdi implements the translation layer between GDB packets and DbgEng (the Windbg engine), allowing QEMU, VMware and all the systems that implement the GDB protocol, to talk with Windbg.
So, let’s make an experiment: let’s build a fully fledged VM in QEMU, and attach it to WindbgExdi…
Step 1 – Download and install QEMU and WindbgExdi
First of all, for this experiment you need a working copy of QEMU and WindbgExdi.
QEMU is very powerful because it is able to work with different “accelerators”. An accelerator is the entity that execute the virtualized code. The default accelerator is called TCG and is not a real accelerator. It is just a pure software emulator, able to execute the target architecture code. It has the huge advantage to be totally platform-independent (and TCG supports a myriad of acrhitectures, at least 60 at the time of this post), but has the drawback to be pretty slow for emulating an entire OS. For this experiment, I suggest to run QEMU on a Intel physical machine running the latest Ubuntu Linux, which provides the KVM accelerator, speeding up around 20x the emulation speed (which supports also nested virtualization scenarios, meaning that your AMD64 VM would be able to run and debug Hyper-V hypervisor).
In this guide, I will provide Linux configuration scripts, but I will show how to use the Windows version of QEMU to debug the Windows 11 UEFI boot loader (if you need help in configuring the Linux version just drop me a mail or a Twitter message 😊). So, let’s first download and install the latest version of QEMU for Windows from https://qemu.weilnetz.de/w64/ (this post assumes that you have installed QEMU in C:\QEMU).
Next, install Windbg or WindbgX from the Platform SKD or from the Store, as explained here: https://learn.microsoft.com/en-us/windows-hardware/drivers/debugger/debugger-download-tools.
Now is time to download and compile WindbgExdi, from its repository: https://github.com/microsoft/WinDbg-Samples/tree/master/Exdi/exdigdbsrv. You will need Visual Studio 2019 or 2022 to be able to compile it. Just open the ExdiGdbSrv solution from the “\WinDbg-Samples\Exdi\exdigdbsrv” folder and compile it in Release (CTRL+SHIFT+B should work directly without any problem, drop me a mail if not.) You should get the following files in the “\Release\x64” subfolder (assuming that you are compiling for AMD64):
- ExdiGdbSrv.dll
- exdiConfigData.xml
- systemregisters.xml
- Other not-important files, like the symbols and the static lib
Those three files should be copied into the Windbg folder (which is usually “C:\Program Files (x86)\Windows Kits\10\Debuggers” or “C:\Program Files\Debugging Tools for Windows” depending on the version of the Debugger package). Now you should modify the “exdiConfigData.xml” to instruct Windbg to connect to GDB in the target. In this guide we will use a local QEMU VM, but if you are going to use Linux in another physical machine, you should set its IP address accordingly… Here is how: locate following section of the XML configuration file, and modify the highlighted part if needed:
<!-- QEMU SW simulator GDB server configuration -->
  <ExdiTarget Name = "QEMU">
      <ExdiGdbServerConfigData ... qSupportedPacket="qSupported:xmlRegisters=aarch64,i386">
      <ExdiGdbServerTargetData targetArchitecture = "ARM64" ... heuristicScanSize = "0xffe" targetDescriptionFile = "target.xml" />
      <GdbServerConnectionParameters MultiCoreGdbServerSessions = "no" ... ReceivePacketTimeout = "3000">
        <Value HostNameAndPort="LocalHost:1234" />
      </GdbServerConnectionParameters>
Step 2 – Set up the VM and configure QEMU
My first advise when dealing with QEMU is to set up the VM using native speed via the Windows Hyper-V (remember to use a UEFI Generation 2 VM).
In this experiment we are trying to debug the undebuggable code, so you need to use the GDB server integrated in QEMU and interface it with the WinDbgEXDI plugin. There is a problem that we need to face before starting. How do you know when you can intercept the code execution? The answer is … you DO NOT! This is why my colleague and friend Alexis from the debugger team had the idea of the “enablejtagbreak” BCD element, which allows you to break before the Windows loader starts.
Before transferring the VM into QEMU, you should enable the BCD element mentioned above. I suggest you to create another Boot Option (since the “enablejtagbreak” can be very dangerous), and also to enable the regular debuggers through the QEMU VirtIo network interface (in that way you can compare EXDI vs Regular. For curious readers, my team designed the VirtIo KDNET extensibility module, so you will be able to use regular KDNET in QEMU). Since this is a lot of work, I created a script able to do it for you:
www.andrea-allievi.com/files/SetupNtDebugger_QEMU.cmd
Just download the script, change the DEBUG_IP, DEBUG_PORT and DEBUG_KEY accordingly (targeting the IP address of your host system) and execute it in the VM. When the script asks if you would like to enable the JTAG Break on the new Boot Entry, simple confirm by pressing the “Y” key.
Now that you are done with the initial VM set up, simply shut it down in HyperV and mount the VHDX. Next step is to inject the QEMU drivers needed for running the VM under QEMU. Open a administrative command prompt and use the following command:
dism.exe /Image:<VHDX_Root> /Add-Driver /Driver:"<QEMU_Drivers_Root>" /recurseWhere:
- “<VHDX_Root>” is the root volume where your VHDX has been mounted… for example “H:\”
- “<QEMU_Drivers_Root>” is the root folder of your QEMU drivers. The latest pre-compiled QEMU drivers for Windows are available here (compiled from their GIT source code repo). Keep in mind that new driver packages are released pretty often. For DISM to work you need to copy all files of the “AMD64” (or the target architecture of your interest) folder of each driver located in the ISO into a separate Root folder of your hard drive. Otherwise DISM will be confused and will not be able to inject the drivers into the VHD
Since creating a QEMU Drivers root folder can be a little a pain, I am providing the correct ones here for you, based on version 0.1.229 of the QEMU package (Feb 2023):
- AMD64 Drivers: www.andrea-allievi.com/files/QEMU_AMD64_Drivers_0.1.229.zip
- ARM64 (AArch64) Drivers: www.andrea-allievi.com/files/QEMU_ARM64_Drivers_0.1.229.zip
When you finished, you need to just unmount the VHDX. Now you have to convert the VHDX in the native QEMU version, called QCOW2. A lot of guides on internet state that this step is not needed, since QEMU supports also the VHDX file format…. but guess what? The VHDX support in QEMU has bugs that randomly corrupt the VHDX, so I advise you to convert the VHDX:
qemu-img convert -c -p -O qcow2 <Source_VHDX_file> <Target_QCOW2_file>Note that the process will actually take some time…
Configuring the VM is one of the big weakness of QEMU, since it use a pretty complicated command line. If you launch the correct QEMU executable (based on the target architecture, usually “qemu-system-aarch64.exe” for ARM64 and “qemu-system-x86_64.exe” for classical AMD64) with the “-help” parameter you will probably get lost in the myriad of parameters that QEMU accept. The idea (coming from Linux) is that the user specifies in detail the target VM configuration (from the motherboard, CPU, graphics card, buses and so on…) entirely on the command line (QEMU supports a lot of combination). Luckily enough, I am providing here handy scripts that can be used to easily launch a ARM64 or AMD64 machine using the TCG accelerator. Similar scripts (suspiciously similar ahahahah 😂) are available also in the official MSDN website on EXDI (https://learn.microsoft.com/en-us/windows-hardware/drivers/debugger/setting-up-qemu-kernel-mode-debugging-using-exdi):
- AMD64 VM Configuration script: www.andrea-allievi.com/files/Qemu_Windows_Amd64_VM.cmd
- AArch64 VM Configuration script: www.andrea-allievi.com/files/Qemu_Windows_Aarch64_VM.cmd
You just need to copy the script in the root folder of QEMU and replace the “<Full_path_of_the_HD_ Image.qcow2>” block with your full path of the virtual hard disk file (QCOW2 or VHDX if you are brave enough.
Note that for this experiment, you can use also a public-available ARM64 VM, which you can freely download from here: https://www.microsoft.com/en-us/software-download/windowsinsiderpreviewARM64. If you are brave enough to change completely the target architecture I suggest you to download the latest “Canary” VHDX. At the time of this blog post, the latest available version is 25324, and, … guess what, …, without this patch it will not even boot because it has a bug preventing Winload to run correctly in QEMU.
Step 3 – Start the VM
If you launch the compiled script a QEMU Windows magically appears and the VM starts to work in TCG, or emulation mode. Note that if you are using the AMD64 version of Windows, the VM will probably get stuck in user-mode, simply because the TCG emulator is not able to correctly emulate the IRET instruction. This is not the point though (if you want to understand how to fix this, continue to read until the Conclusions), user-mode is already too late. We want to debug the transition code or something undebuggable.
So, let choose the second boot entry: “Debug Windows 11 QEMU” if you used my script. The VM will seem to be dead, showing just a black screen. We need to attach the hardware debugger via WindbgExdi. Press the key combination CTRL+ALT+2 (or choose the “compatmonitor0” item from the View menu) to interact with the QEMU monitor. Then type the “gdbserver” command and press enter. If all goes well QEMU should reply by showing the message: “Waiting for gdb connection on device ‘tcp::1234′”.
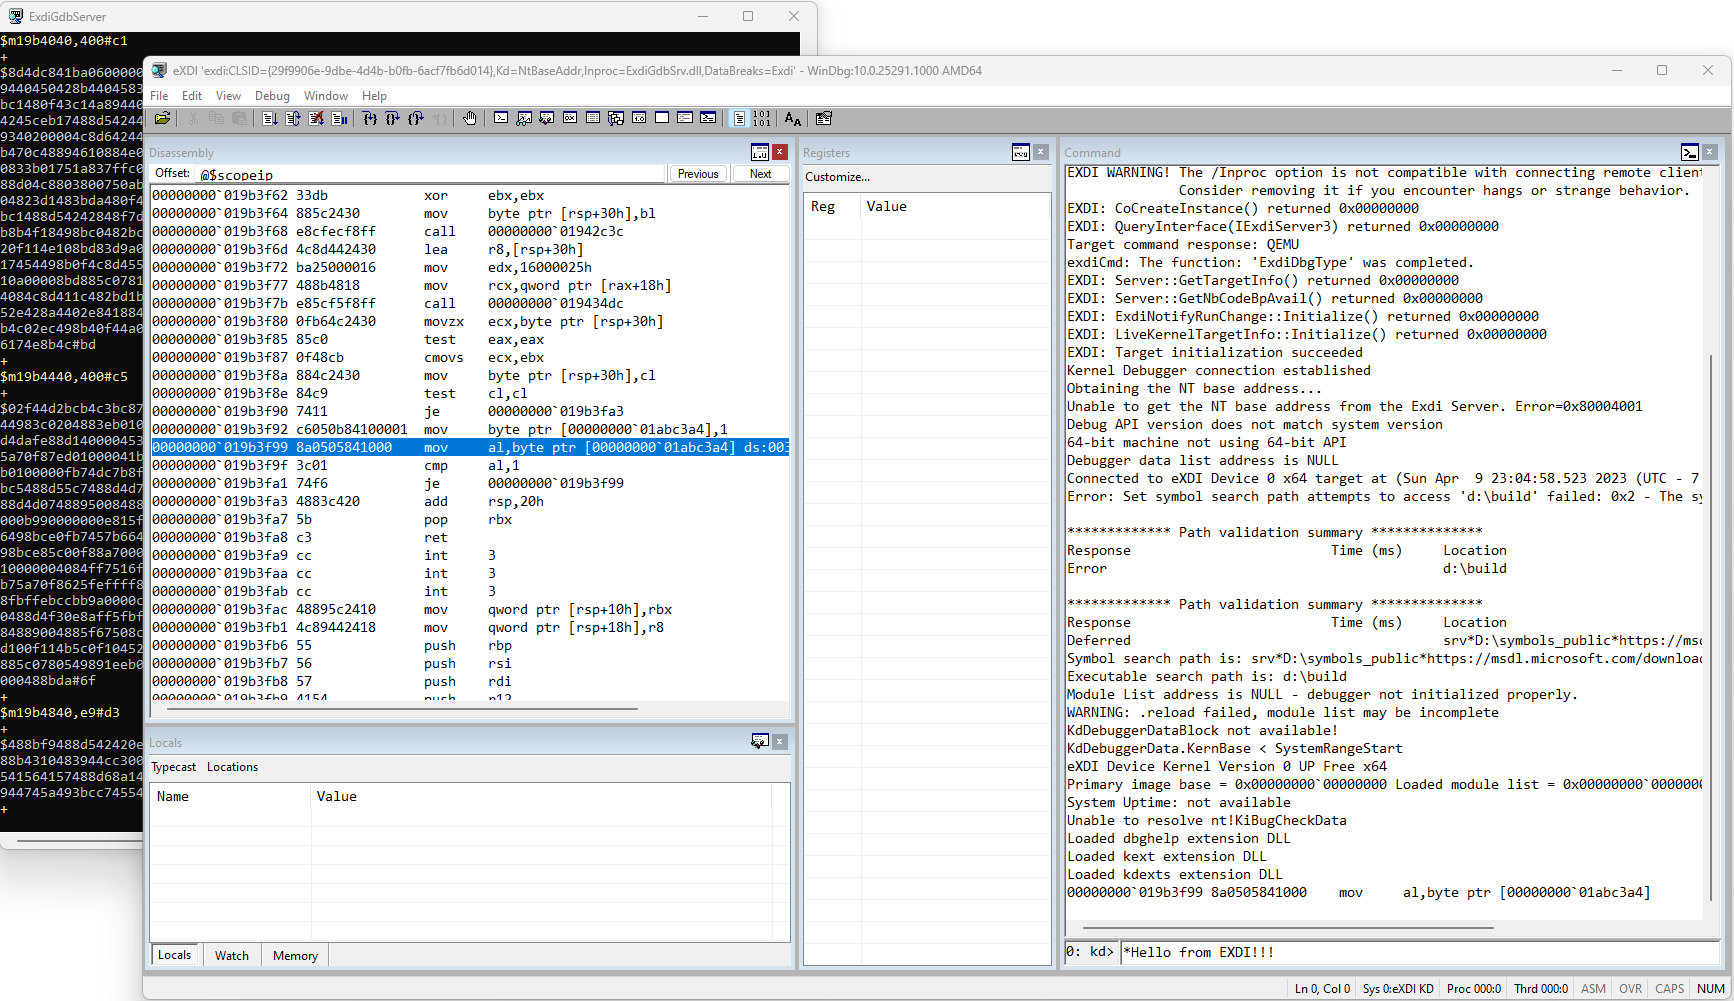
It is now time to connect WindbgEXDI. Open a command prompt window, go to the Windbg installation path and launch it with the following command (which tells to Windbg to load the ExdiGdbSrv in-proc COM class):
windbg.exe /noredirect -v -kx exdi:CLSID={29f9906e-9dbe-4d4b-b0fb-6acf7fb6d014},Kd=NtBaseAddr,Inproc=ExdiGdbSrv.dll,DataBreaks=ExdiIf all goes fine (and you configured correctly the exdiConfigData.xml), the Debugger will open a black dialog box, called ExdiGdbServer, and you will see a lot of unreadable commands in it. The Windbg main window will magically appears, but still pretty confused:
Part 1 – Conclusions
It is 11 PM of Sunday night (today was Easter), and I am pretty tired. If you have reached this point it means that you succeeded in the initial configuration of your WindbgEXDI interface. This, together with QEMU, is super-powerful and allows you to debug like a PRO. In the next part of the blog post we will analyze super-fancy tricks to debug a lot of undebuggable code. Stay tuned! … And of course let me know what do you think about this in the comment section below 😊….
Hope you enjoyed Easter and didn’t get tired too much 😄, It’s pretty complicated and I’m sure just a few folks that don’t have another choice will try it 😉😎.
Everything that comes from the Linux world is complicated. I assume that people that need this kind of debugging are already expert… so setting up this thing with the help of my scripts should be a trivial work for them!
Thanks for reading!
Andrea
Would GDB also work to connect to the GDB server stub in QEMU to debug Windows? What is the difference with WinDbgEXDI?